Lab
Want to try it yourself? Follow this self-contained lab: a disposable local kind cluster running Cilium, pre-loaded with a generic web-app/ Postgres/Prometheus scenario, so you can reproduce a real catch end to end on your own laptop — nothing to match against someone else’s cluster. Every command below is copy-paste; every step says exactly what you should see before moving to the next one.
What you’re about to break (on purpose)
| Role in the story | Workload |
|---|---|
| The database the candidate policy locks down | postgres (with a postgres-exporter sidecar) |
| The app it correctly allows | webapp → postgres:5432 |
| The scrape it silently breaks | prometheus → the exporter’s :9187 |
| The probe it silently breaks | kubelet’s own TCP health check → :5432 |
Locking a database down to “just the app” and forgetting the exporter + the probe is one of the most common real NetworkPolicy mistakes platform teams make — this lab reproduces exactly that.
Prerequisites
mise, Docker,
kind,
helm, and kubectl already
installed and on your PATH. lab-up checks for the last four and
tells you what’s missing — it never installs anything for you.
Then clone the repo and move into it — every command below assumes you’re running from inside this checkout:
git clone https://github.com/tchellomello/guardbee.git
cd guardbee
Step 1 — Bring the lab up
mise run lab-up
Creates a kind cluster named guardbee-lab, installs Cilium
(v1.20.2 — matching go.mod’s pinned version exactly) with Hubble and
Hubble Relay enabled, then deploys the three workloads above. Takes a
few minutes — most of it is Cilium’s own images pulling and the agent
coming up.
guardbee lab: creating kind cluster "guardbee-lab"...
Creating cluster "guardbee-lab" ...
 ✓ Ensuring node image (kindest/node:v1.36.1)
 ✓ Preparing nodes
 ✓ Writing configuration
 ✓ Starting control-plane
 ✓ Installing StorageClass
 ✓ Joining worker nodes
Set kubectl context to "kind-guardbee-lab"

guardbee lab: installing Cilium 1.20.2 into cilium-system...
guardbee lab: waiting for Cilium and hubble-relay to report ready...
guardbee lab: deploying webapp / postgres / observability workloads...

guardbee lab is up. kubeconfig context: kind-guardbee-lab
Missing Docker, kind, or helm?
lab-upfails fast and names exactly what to install — it won’t try to install anything for you.
Hit a problem running mise run lab-up? (podman users)
could not find a log line that matches "...Multi-User System..."
Common if docker is aliased to podman (e.g. on NixOS) — kind’s node
container runs its own nested systemd, and podman’s default journald
log driver doesn’t surface that back through podman logs, so kind’s
own boot check times out even though the container booted fine. Fix,
bash/zsh:
CONTAINERS_CONF=<(printf \
    '[containers]\nlog_driver = "k8s-file"\n') \
  mise run lab-up
fish:
CONTAINERS_CONF=(printf \
    '[containers]\nlog_driver = "k8s-file"\n' | psub) \
  mise run lab-up
Or set log_driver = "k8s-file" under [containers] in your own
containers.conf permanently instead of passing it per-invocation.
/sys/fs/bpf: permission denied, even after that
A different, deeper issue: rootless podman’s own privilege ceiling,
not the log driver. Cilium’s agent needs to mount the BPF filesystem,
which a rootless container can’t do no matter how containers.conf is
set. Check whether rootful podman is available:
sudo podman info --format '{{.Host.Security.Rootless}}'
false means yes — rerun the whole script with sudo -E (the -E
matters: plain sudo resets $HOME to /root, which would write the
kubeconfig there instead of your own ~/.kube/config):
sudo -E env KIND_EXPERIMENTAL_PROVIDER=podman \
  CONTAINERS_CONF=<(printf \
      '[containers]\nlog_driver = "k8s-file"\n') \
  bash lab/scripts/lab-up.sh
fish:
sudo -E env KIND_EXPERIMENTAL_PROVIDER=podman \
  CONTAINERS_CONF=(printf \
      '[containers]\nlog_driver = "k8s-file"\n' | psub) \
  bash lab/scripts/lab-up.sh
Step 2 — See real traffic, before touching any policy
guardbee flows -n postgres --last 50
Rows for all three kinds of real traffic already hitting postgres,
timestamps and pod-name suffixes aside (--last 20 can miss the
Prometheus scrape — it’s much less frequent than webapp’s polling —
--last 50 reliably catches all three):
2026-10-14T20:02:54Z  FORWARDED  webapp/webapp-xxxxx
  -> postgres/postgres-xxxxx  TCP:5432
2026-10-14T20:02:54Z  FORWARDED  reserved:host
  -> postgres/postgres-xxxxx  TCP:5432
2026-10-14T20:02:54Z  FORWARDED  observability/prometheus-xxxxx
  -> postgres/postgres-xxxxx  TCP:9187
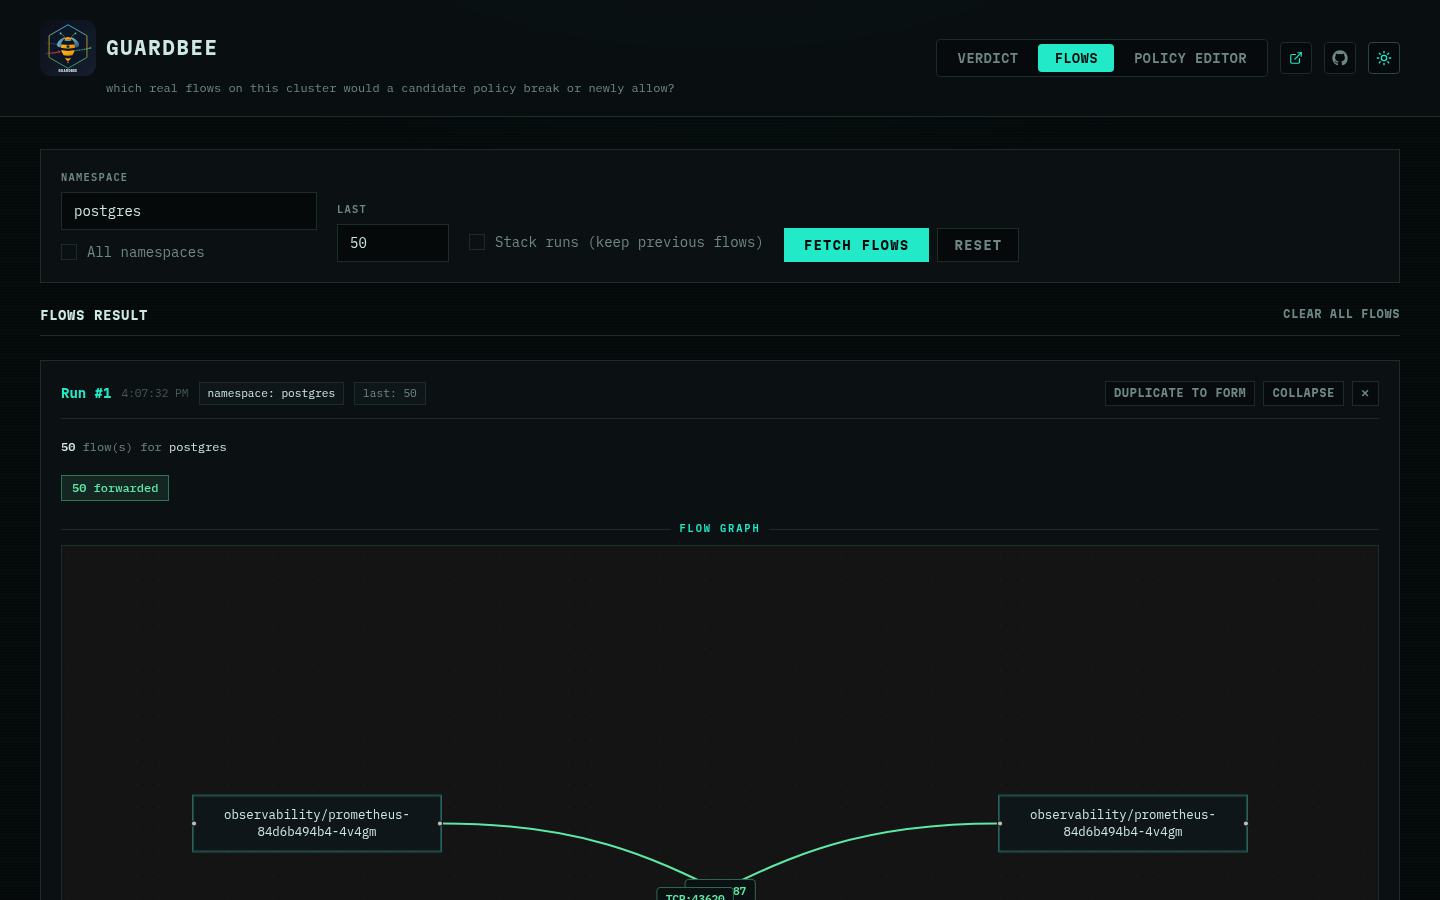
Same traffic, in the UI’s Flows tab (guardbee ui, 127.0.0.1:4747 by
default) — same engine, same cluster, just a graph instead of table rows.
This is the baseline — there’s no CNP on postgres yet, so everything
is allowed. That’s what the next step is about to change.
Step 3 — Run verdict against the looks-correct candidate
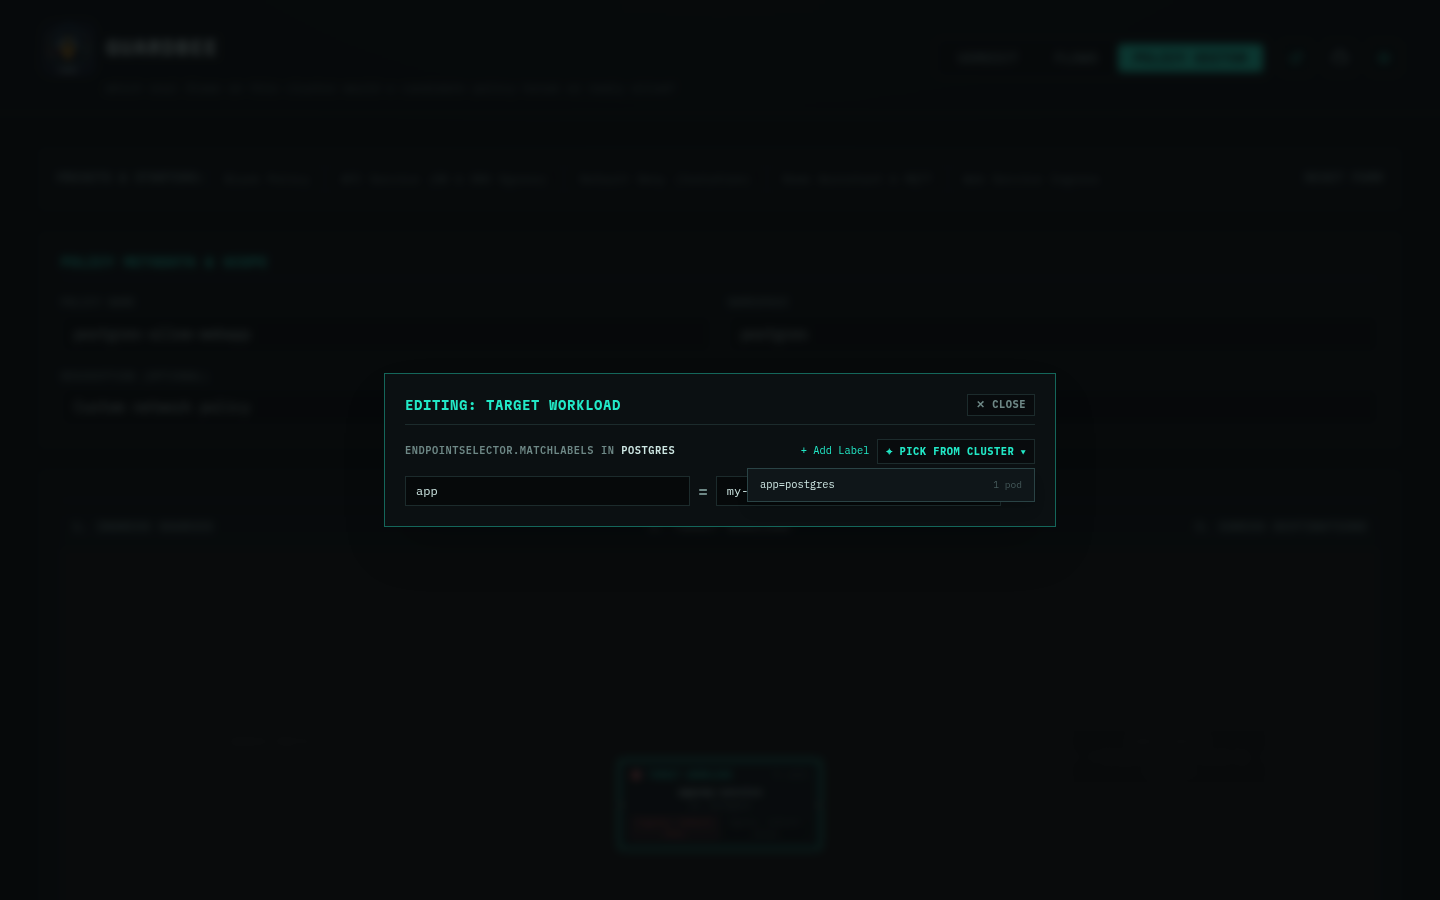
Prefer building the candidate visually instead of editing YAML? The Policy Editor’s cluster-grounded picker pulls
app=postgresstraight from the live cluster, not a guess: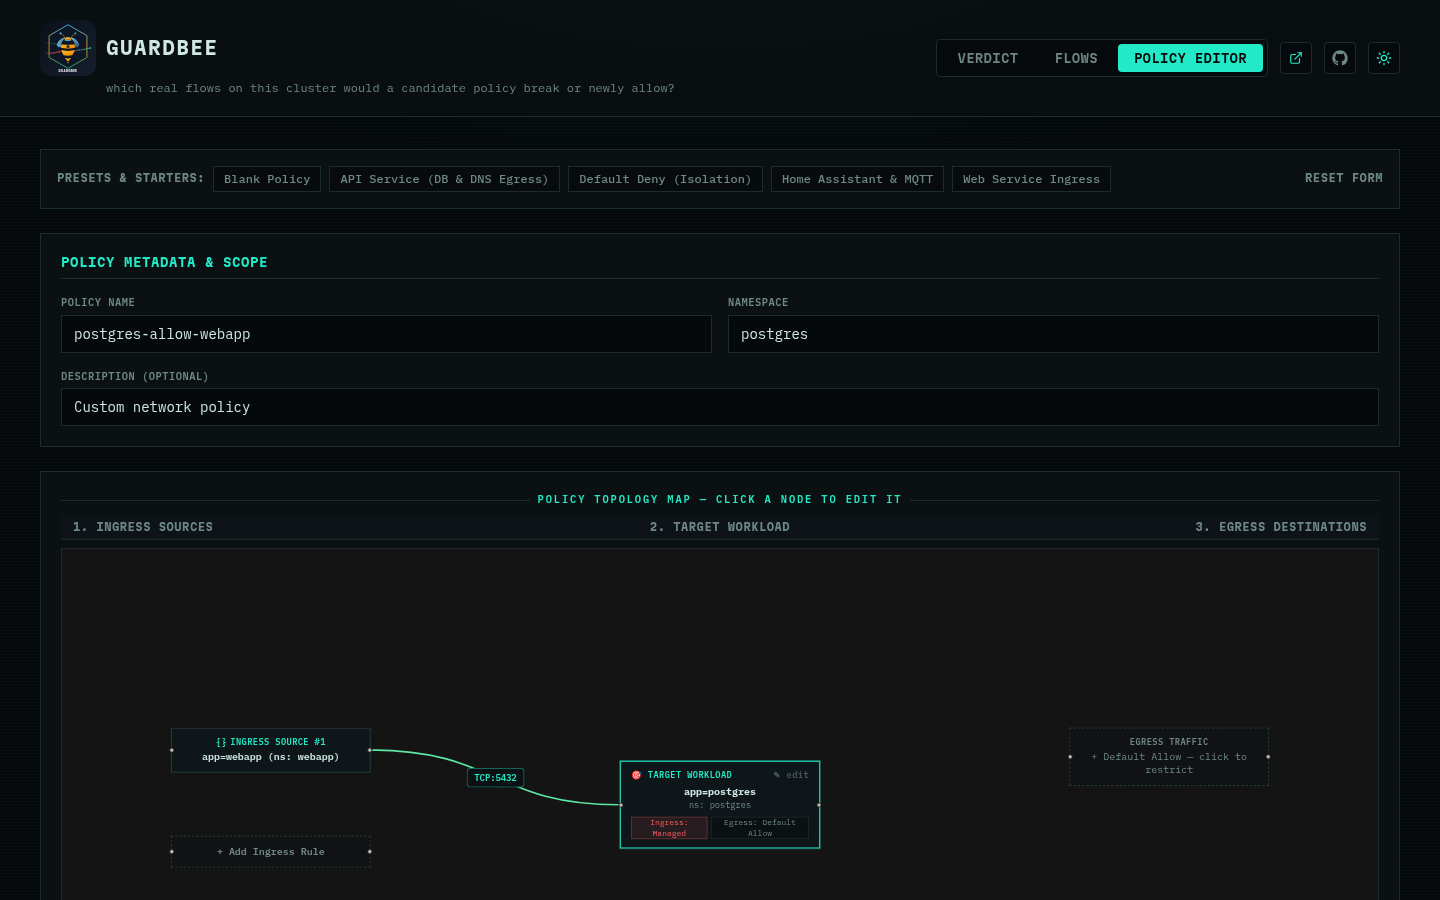
guardbee verdict -n postgres --last 50 \
  lab/candidates/looks-correct.yaml
Judging 1 candidate rule(s) from looks-correct.yaml against 0
live rule(s) already in postgres, using 50 sampled flows.

NEWLY_DROPPED  observability/prometheus-xxxxx -> postgres/postgres-xxxxx
  TCP:9187  (currently allowed; this candidate would start blocking it)

NEWLY_DROPPED  reserved:host -> postgres/postgres-xxxxx
  TCP:5432  (currently allowed; this candidate would start blocking it)
  (seen 16x in this sample)

50 flows sampled: 15 unchanged, 17 newly dropped, 0 newly
allowed, 0 not simulated, 18 reply (skipped)

17 real flow(s) would BREAK if this candidate merged as-is —
review the NEWLY_DROPPED rows above before shipping it.
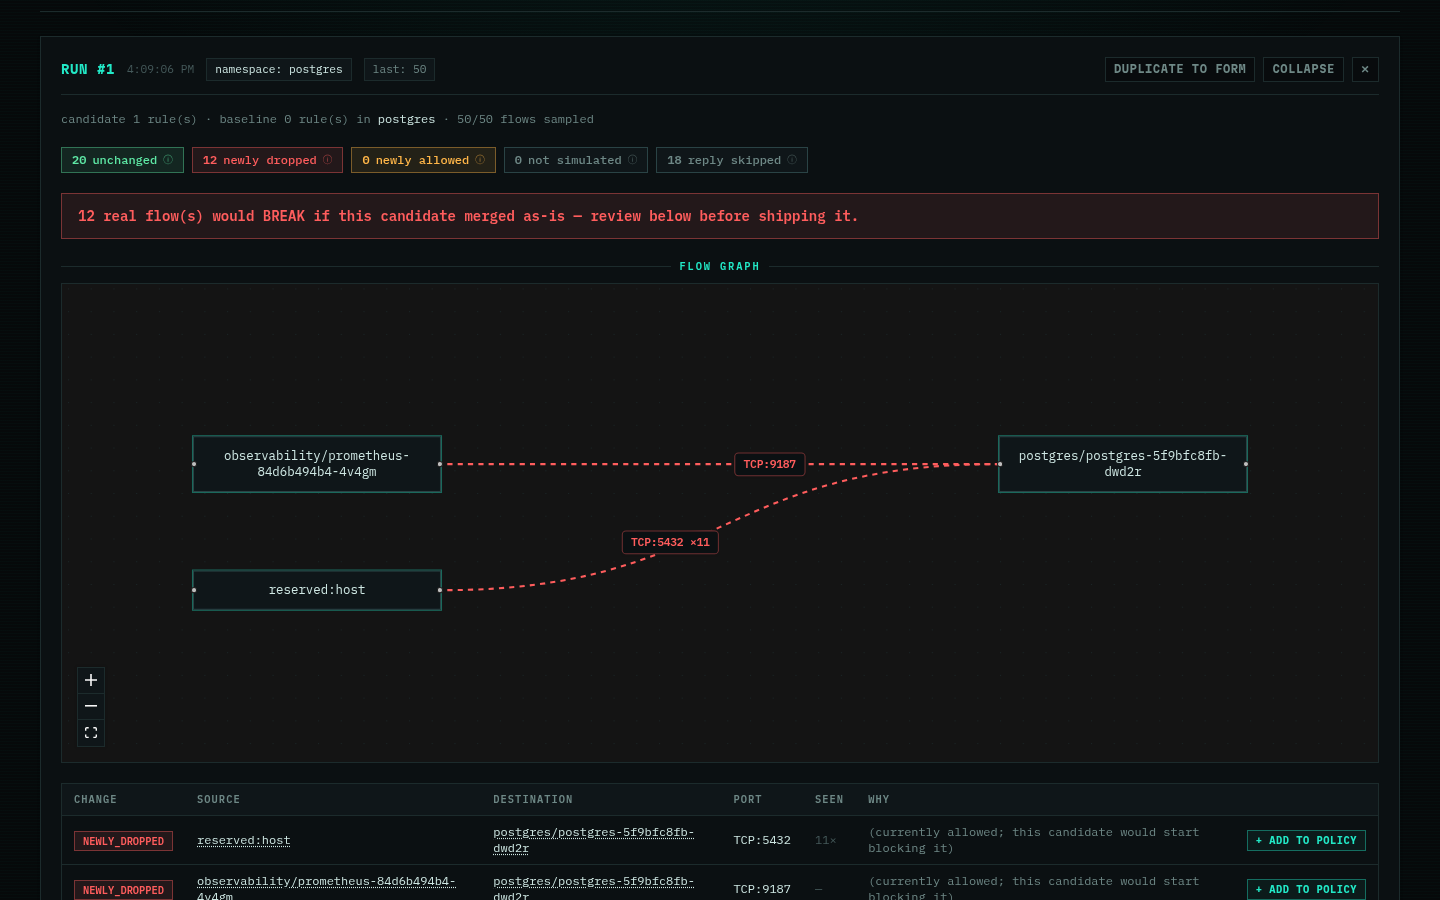
Same regression, in the UI — the two NEWLY_DROPPED rows and the red
dashed edges on the flow graph are the same verdict the CLI just gave
you.
Exact flow counts depend on your sample — the two NEWLY_DROPPED rows
are the part that won’t change. The candidate looks completely
reasonable (it correctly allows webapp’s real traffic) and was never
applied to the cluster — verdict reads it as a plain file and
simulates it, so nothing above risked breaking anything real.
Try it yourself: can you spot the fix before Step 4?
Before copying Step 4’s command, try finding the fix yourself. Open
guardbee ui, go to the Verdict tab, and look at the flow graph
from the regression above — each red dashed edge points at exactly one
peer the candidate forgot, with the port it needs labeled right on the
edge. Two gaps, two peers. (Hint: one of them isn’t a pod at all — look
at what it’s named instead of namespace/pod.)
Here’s the entire fix — the real diff between the two candidate files
in lab/candidates/:
--- looks-correct.yaml
+++ merge-ready.yaml
@@ -19,4 +19,18 @@
       toPorts:
         - ports:
             - port: "5432"
+              protocol: TCP
+    - fromEndpoints:
+        - matchLabels:
+            app: prometheus
+            io.kubernetes.pod.namespace: observability
+      toPorts:
+        - ports:
+            - port: "9187"
+              protocol: TCP
+    - fromEntities:
+        - host
+      toPorts:
+        - ports:
+            - port: "5432"
               protocol: TCP
That’s a 1:1 map onto the UI: each NEWLY_DROPPED row’s + Add to
Policy button writes exactly one of these added blocks for you. Click
both, from Step 3’s result, and you’ve produced merge-ready.yaml
without typing any YAML — same fix, same verdict, Step 4 just runs it
for you.
Step 4 — Run verdict again against the fix
Instead of hand-editing the merge-ready YAML, clicking + Add to Policy on a
NEWLY_DROPPEDrow from Step 3’s UI result reopens the Policy Editor with that exact rule pre-filled — label, namespace, and port already matched from the live flow: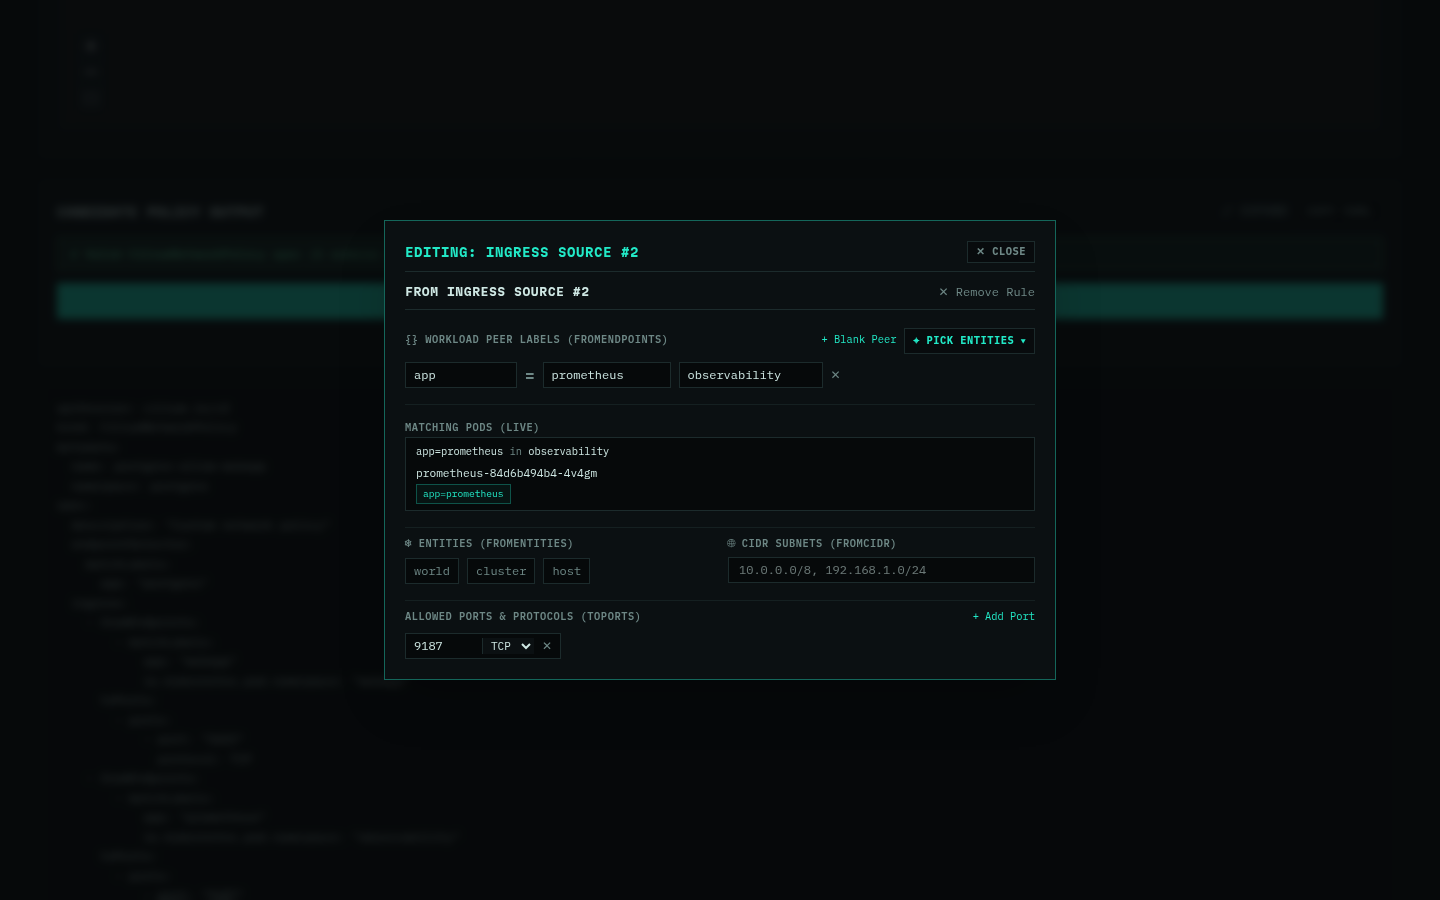
guardbee verdict -n postgres --last 50 \
  lab/candidates/merge-ready.yaml
Judging 1 candidate rule(s) from merge-ready.yaml against 0
live rule(s) already in postgres, using 50 sampled flows.

50 flows sampled: 31 unchanged, 0 newly dropped, 0 newly
allowed, 0 not simulated, 19 reply (skipped)
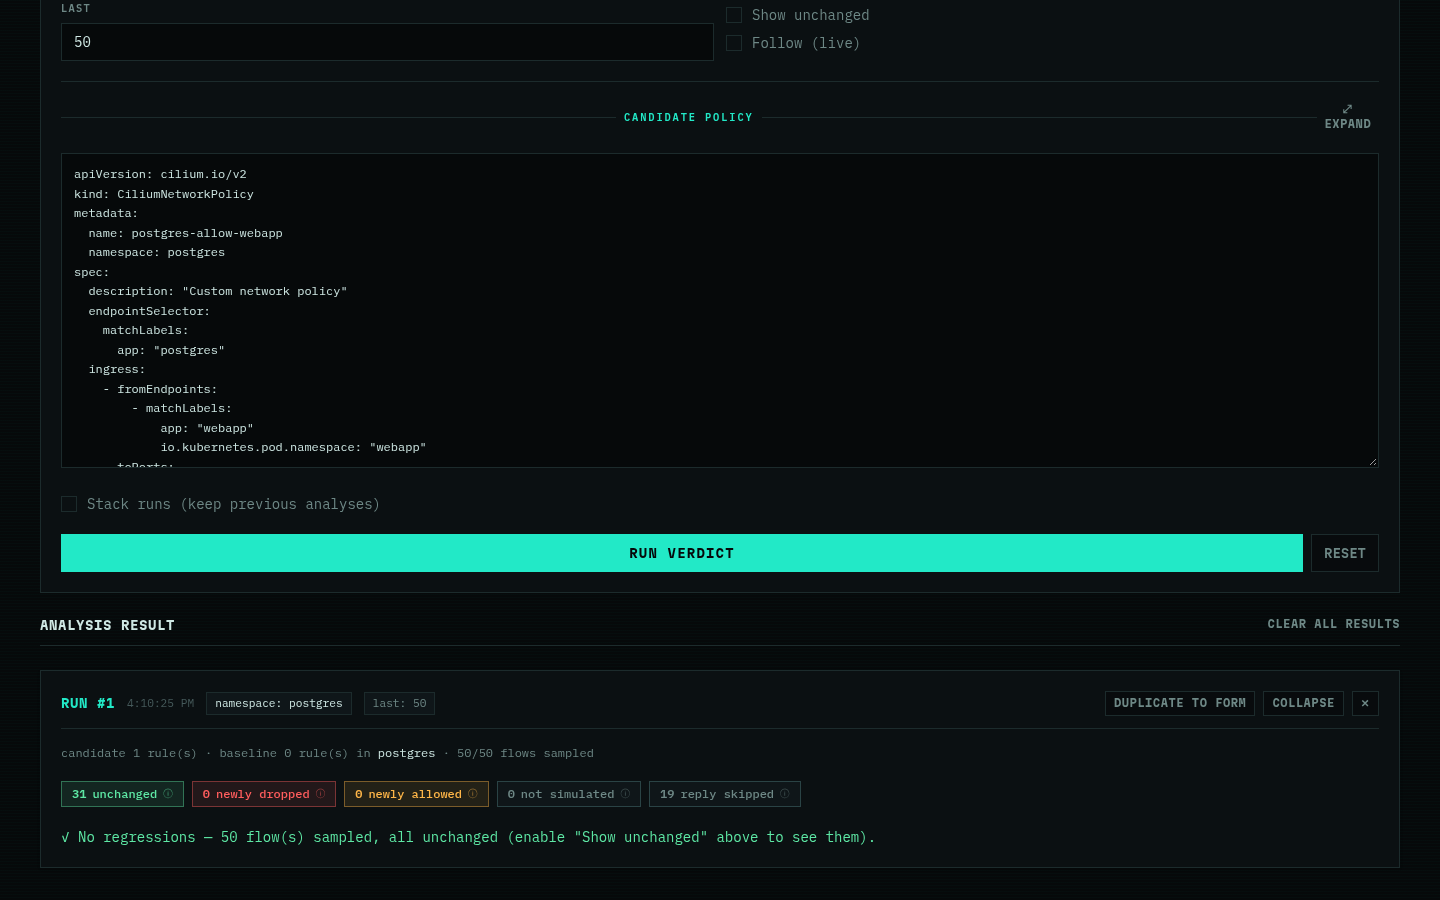
Same clean result in the UI — zero dropped, zero allowed, same “no regressions” verdict the CLI just gave you.
Same candidate, corrected — it explicitly allows the exporter scrape and
the host probe alongside the app traffic. Zero NEWLY_DROPPED, zero
NEWLY_ALLOWED: safe to merge. See
how verdict works for what each of those counted
categories means.
Step 5 — Tear down
mise run lab-down
Deletes the guardbee-lab kind cluster. Nothing else on your machine was
touched by any of the steps above.